Why Shopify's Page Speed Upgrade Skipped Nilan's Store
Shopify's August Early Hints rollout trimmed LCP 100ms at p75. On Nilan's audit last week, the shopify page speed score didn't budge. Here's why.
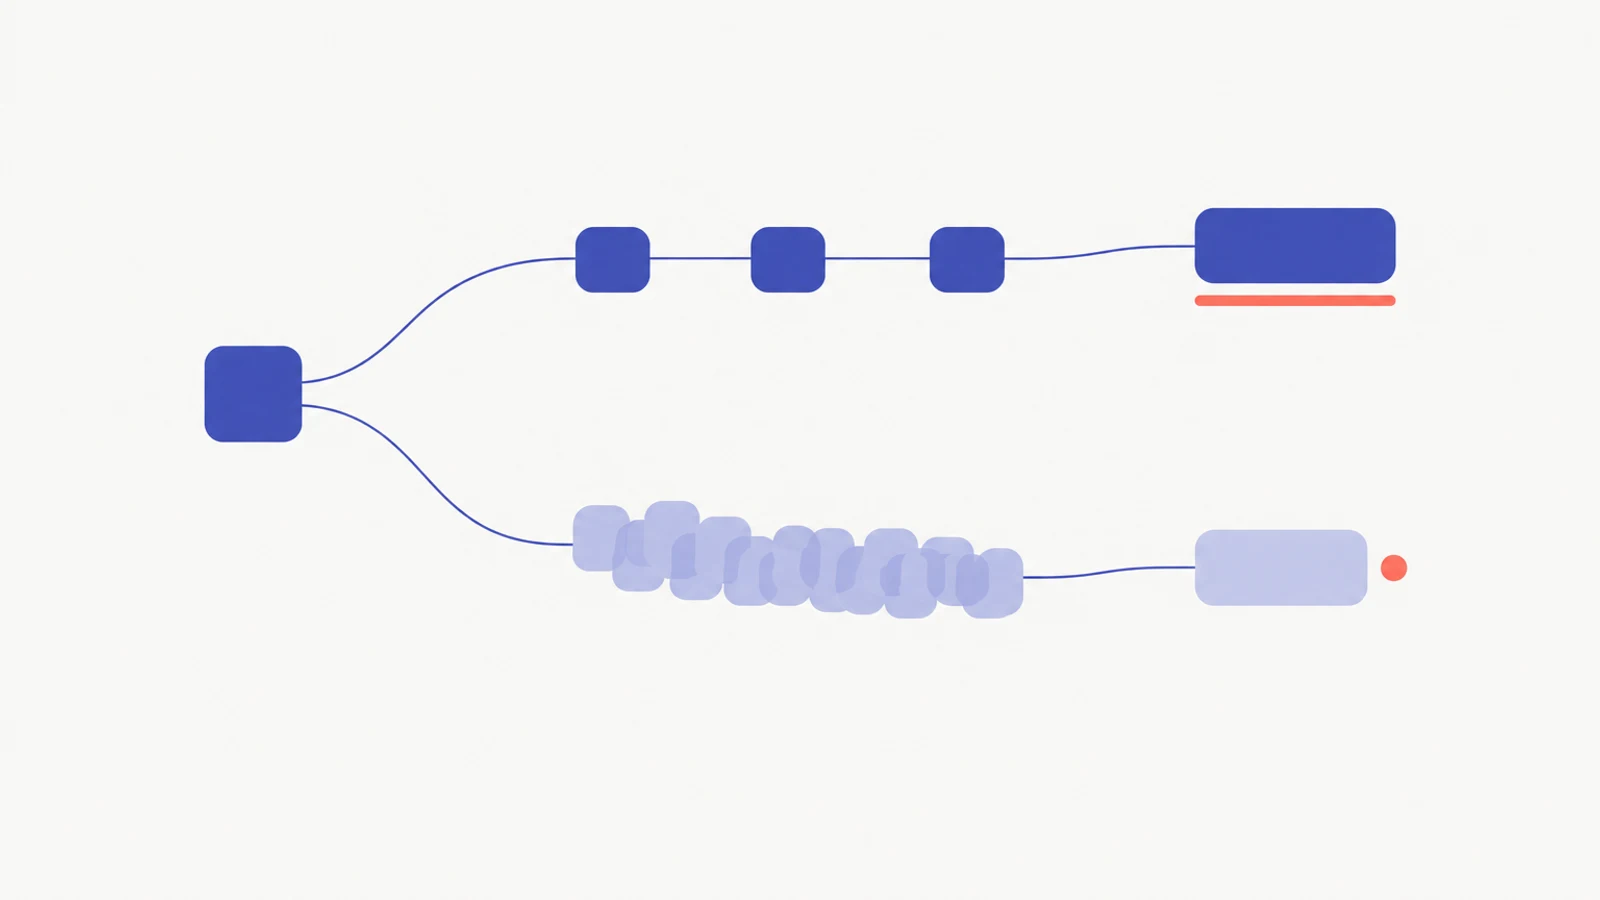
Nilan runs a hand-poured candle company out of a converted garage in Bristol. Twelve SKUs, three scents per SKU, roughly 900 orders a month, Dawn theme that he set up himself in late 2024 and has not touched since. In October he got a newsletter in his inbox saying Shopify's platform had made every store faster. He checked his shopify page speed score the next morning expecting a number he could brag about at the next maker fair. 47. The exact same 47 it had been in September. The exact same 47 it had been in July. He emailed help1.
What Nilan had tried
By the time he reached me he had three months of lab-score screenshots in a Notion page. He had compressed every product image to under 200 KB. He had switched his hero from a 2200-pixel-wide PNG to a WebP at the exact rendered size. He had removed three apps he was no longer using and replaced his page builder with Dawn's native hero section. He had read the Shopify Performance blog post from August 28 announcing automatic Early Hints, understood roughly what Early Hints were, and figured his store was now benefiting from them. He expected the shopify page speed rollout to add at least a few points to his score.
Nothing moved. 47 at the start of October. 47 after the compression round. 47 after the app removal. 47 the morning he emailed us.
The message he sent closed with one line: "I do not know what else to try and I am losing trust that any of this reporting is real." That sentence is the one I come back to in these audits. The merchant has genuinely done the work. The number is genuinely not responding. The usual script ("compress your images, remove unused apps, pick a faster theme") is the script Nilan had already run twice over.
Why nothing worked
The first thing I did was ignore his PageSpeed score entirely and pull up his Core Web Vitals report in Google Search Console. That is where the actual story lives. The lab test (PSI, Lighthouse, the number everyone emails about) is Chrome running your site once on a simulated phone. The field data (CrUX, under Experience > Core Web Vitals in Search Console) is what real shoppers' phones actually did over the last 28 days. The two numbers can drift apart by a factor of five, and often do.
Nilan's field data: mobile LCP median 2.1 seconds, 68% of URLs in "Good" territory. His lab LCP: 9.8 seconds, score 47. That gap is not unique to him. The DanielBuilds analysis of 11,074 Shopify stores published on November 9 found a median lab LCP of about ten seconds against a median field LCP of about two seconds, and roughly four in ten stores scoring below 50 on the lab test were still passing all three Core Web Vitals in real field data. A low score does not automatically mean shoppers think your store is slow.
So the first finding was that Nilan's real customers were not having a bad experience. His conversion rate was fine. His bounce rate was fine. The number he had been chasing for three months was mostly a signal from a synthetic test, not from his shoppers.
That still left the question of why the shopify page speed rollout had not visibly helped him even in the lab. Shopify's own measurement said FCP down 76 ms, LCP down 100 ms at p75. On a 9.8 second lab LCP, 100 ms is around a 1% change. It rounds into noise on a single run. On a store where the lab LCP is closer to 2.5 seconds, 100 ms is a 4% change and would land as a visible score bump.
The platform improvement was real. It landed. It just landed on the part of his load timeline that was not the bottleneck.
Where the actual time was going
I opened Chrome DevTools on a cold mobile emulation, throttled to Slow 4G, and sorted the network tab by domain. Nilan had twelve apps installed, which is roughly median for a store his size. Nine of the twelve shipped frontend scripts. Across his homepage I counted:
- A cookie consent banner firing about 180 ms of script evaluation before anything else.
- A review widget loading 420 KB of JavaScript to render star ratings he was not actually displaying above the fold.
- A subscription app injecting a 290 KB bundle on every page regardless of whether the page offered subscriptions.
- A chat widget whose SDK weighed 310 KB and ran its own render tree, loaded on first paint rather than on user intent.
- A Google Tag Manager container that was spending 311 ms of main thread time evaluating.
That GTM number is the one I want to call out. One of the most-cited data points in this quarter's r/shopify threads is a store where GTM alone performed 329 ms of JavaScript evaluation, essentially equal to the entire first-party theme JavaScript on the same store. Nilan's number was 311. The tag manager is designed to defer third-party tags; in practice, on a Shopify storefront loaded by nine different app vendors, it ends up matching the cost of your whole theme.
Total blocking time on Nilan's homepage: around 1,420 ms. Shopify's Early Hints gain of 76 to 100 ms at p75 is smaller than a tenth of that blocking budget. The platform improvement cannot move his number because his bottleneck is not where the platform improves things.
The surprise I almost missed
Last year Nilan had followed a popular theme tutorial and added image_tag: preload: true to his hero image. He expected that hint to tell the browser "download this image first". He checked DevTools at the time, saw the image show up early in the waterfall, and moved on.
I opened the response headers on his homepage and counted the Link entries. Shopify sends at most 10 preload Link headers per page response, documented explicitly in the current developer guidance. The priority order is stylesheets first, then fonts and other preloads, then scripts, then images last. On an app-heavy store, the automatic scan fills the first slots with render-blocking resources from installed apps. Nilan's Link header had 10 entries. Not one of them was his hero image. The cookie banner stylesheet, the review widget script, the subscription bundle, the chat SDK, two fonts, two theme stylesheets, two more app scripts. His hero preload hint was eligible but had no slot to land in.
This is the trap I want more merchants to hear about. The advice to add fetchpriority="high" and loading="eager" and a preload hint on your LCP image is correct advice. It is given in every guide. And on a store with too many render-blocking resources in the <head>, the actual preload Link header is silently full before the image hint is considered. The hint is there in the theme code; the hint is not there in the response.
If you want a second pair of eyes on which of your preload hints are actually reaching your response headers, that is exactly what help1's expert chat is for. The first fifteen minutes are free and I have a saved DevTools walkthrough that catches this in about three minutes.
What we ended up doing
I wrote Nilan a two-part plan.
Part one, same day: stop treating the PSI score as the primary signal. Watch Search Console's Core Web Vitals report for the next 28 days. That is the number his shoppers are actually generating.
Part two, over the next two weekends:
- Delete the subscription app. He had not sold a subscription in six months and the bundle was still loading on every page.
- Replace the chat widget with one that lazy-loads on user intent rather than on first paint. The help1 writeup on app-heavy shopify page speed bottlenecks covers the specific swap in more detail.
- Move the GTM container to load on
requestIdleCallbackor after the first user interaction. This alone would reclaim about 300 ms of blocking time. - Set up server-side GTM later, if he wanted to keep tracking fidelity. Not urgent; the weekend task was just getting the client-side load off the critical path.
- Leave the hand-authored hero preload hint in place for now. Once the three app changes above land, the response
Linkheader will have slots available, and the image preload will finally arrive.
Expected result on his lab score if he does parts 2 through 4: roughly 60 to 68, up from 47. At that score his lab LCP will be around 4 seconds, and the Early Hints 100 ms gain will be a 2-3 point score improvement he can actually see. More importantly, his field LCP will drop from 2.1 seconds to the 1.3 to 1.6 second range, where "Good" turns into "shoppers do not notice at all".
What this means for your store
If you have been checking your shopify page speed score every week since August and watching for a bump that never arrived, you are in a specific category of merchant. Shopify's platform improvement is real: Early Hints shaved 76 ms off FCP and 100 ms off LCP at p75 for eligible pageviews, and the September 2026 HTML Streaming rollout cut TTFB by 29% at the median. The gains are measured against a baseline most Shopify merchants are not on. If your total load time sits above 4 seconds, 100 ms is a rounding error. The gains land but you cannot see them under the noise of your app stack.
Hold two layers in your head. Shopify controls the resource-delivery layer. They shaved time off it this year, and if you are on a lean theme with few apps you received the benefit automatically. You control the script-execution layer. Every app that ships frontend JavaScript adds blocking time, and that number does not fall because Shopify shipped a feature. It falls because you remove the app, replace it with a lazy-loaded alternative, or move it off the critical path.
Before you spend another weekend compressing images, do the Search Console check. If your field data shows "Good", the only thing left to fix is your anxiety about the lab score. If your field data shows "Needs improvement" or "Poor", the app-script layer is almost certainly where the time is going. Chrome DevTools, mobile emulation, sorted by domain, cold load. That waterfall is the audit.
Nilan is on the plan. Three apps gone last Sunday, GTM moved off the critical path the Saturday after, his lab score passed 60 this morning. He emailed back saying he owed someone a candle. I told him to send it to his analytics provider.
Still stuck? Talk to an expert.
Our vetted Shopify experts can fix this issue for you in a live session. $39 per session. Your first 15 minutes are free.